A tale of two tech cities
Austin built through its boom and rent came down, while San Francisco built little and its rent has just hit a record.

Writing about this? Charts, data and findings you can quote.
Think back to 2021 and you could have guessed how this would go. Downtown San Francisco had emptied out, people were supposedly fleeing, and Tesla and Oracle were moving their headquarters from California to Austin. That summer in Austin, a 29-year-old named Elisa Regulski had put in half a dozen rental applications, with days left on her lease, when a realtor told her people were bidding $200 to $300 a month over the asking rent.
For a while that is how it went, with rent soaring around Austin and sagging around San Francisco. Then Austin's came down, San Francisco's took off, and early in 2026 the San Francisco metro passed the Austin metro on growth since the end of 2019. Behind that swap are two very different stretches of building, an AI boom that only one of them got, and the plain fact that one of them has nowhere left to spread.
Data Provided by Zillow Group: Zillow Observed Rent Index, asking rents in dollars, through Sep 2026. Each dot is one of 47 metro areas of a million people or more, at the end of each year and in the latest month. Hover or tap a dot.
Use this chart in your article: chart image, data (CSV), how to credit.
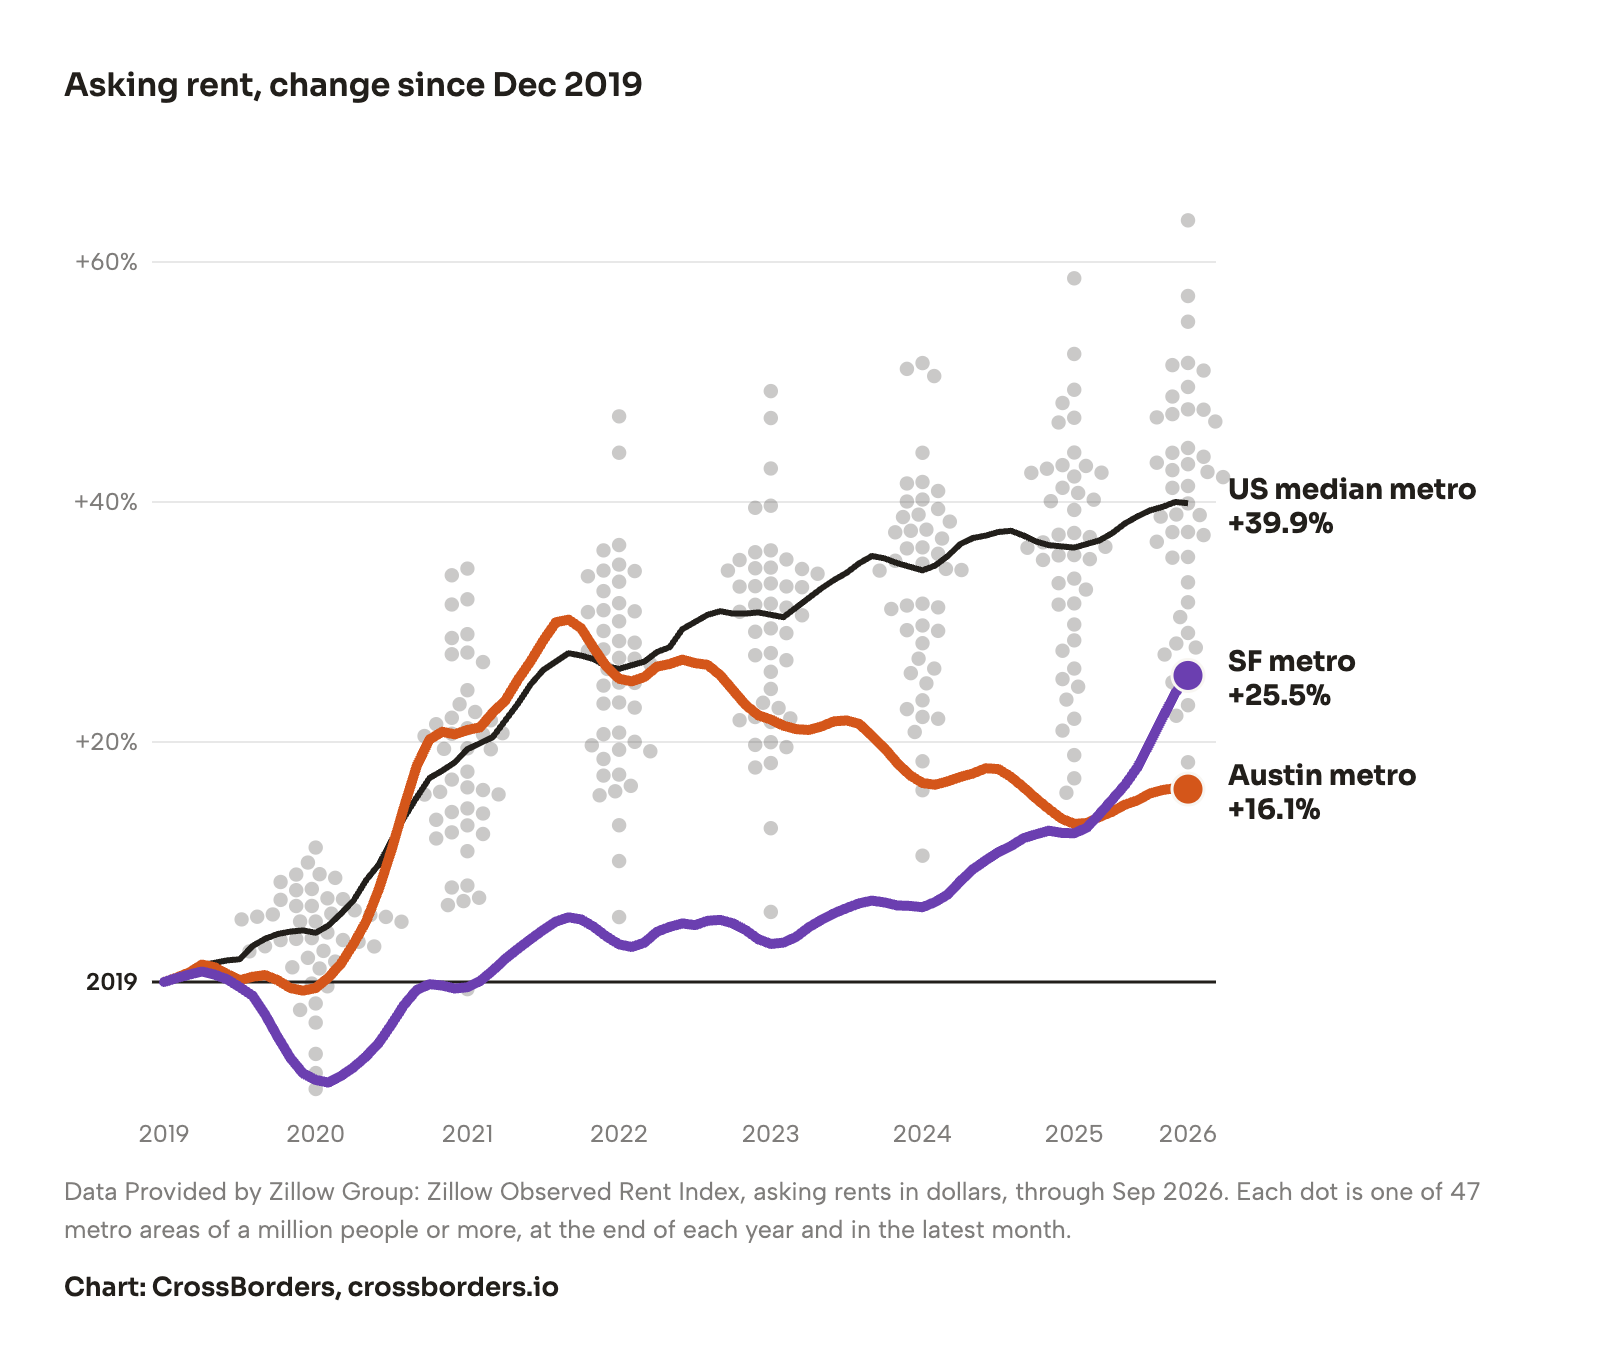
Almost everywhere else, rent just kept climbing, and 40 of 47 big metros have set a record this year. The San Francisco metro is one of them, though it fell so far in the pandemic that it is still behind the US median metro. The Austin metro is the odd one out, 10.8% below its Aug 2022 peak, when no other big metro is more than 3.8% below its own.
Austin, from Lady Bird Lake. Photo: Phil Evenden / Pexels.
Austin kept building through its boom
The frenzy of 2021 looked like a gift to anyone who could put up an apartment building in Austin. Rents were climbing, interest rates were at rock bottom and people kept arriving from other cities, which made it, as Jake Wegmann of the University of Texas told KUT, "a really great place to get into the apartment-owning business." The local joke became that the official bird of Austin was the crane.
Data Provided by Zillow Group: Zillow Observed Rent Index, asking rents in dollars; U.S. Census Bureau, American Community Survey and Building Permits Survey. Metros of a million people or more whose boundaries didn't change in 2023. Each row has its own scale. Hover or tap a dot.
Use this chart in your article: chart image, data (CSV), how to credit.
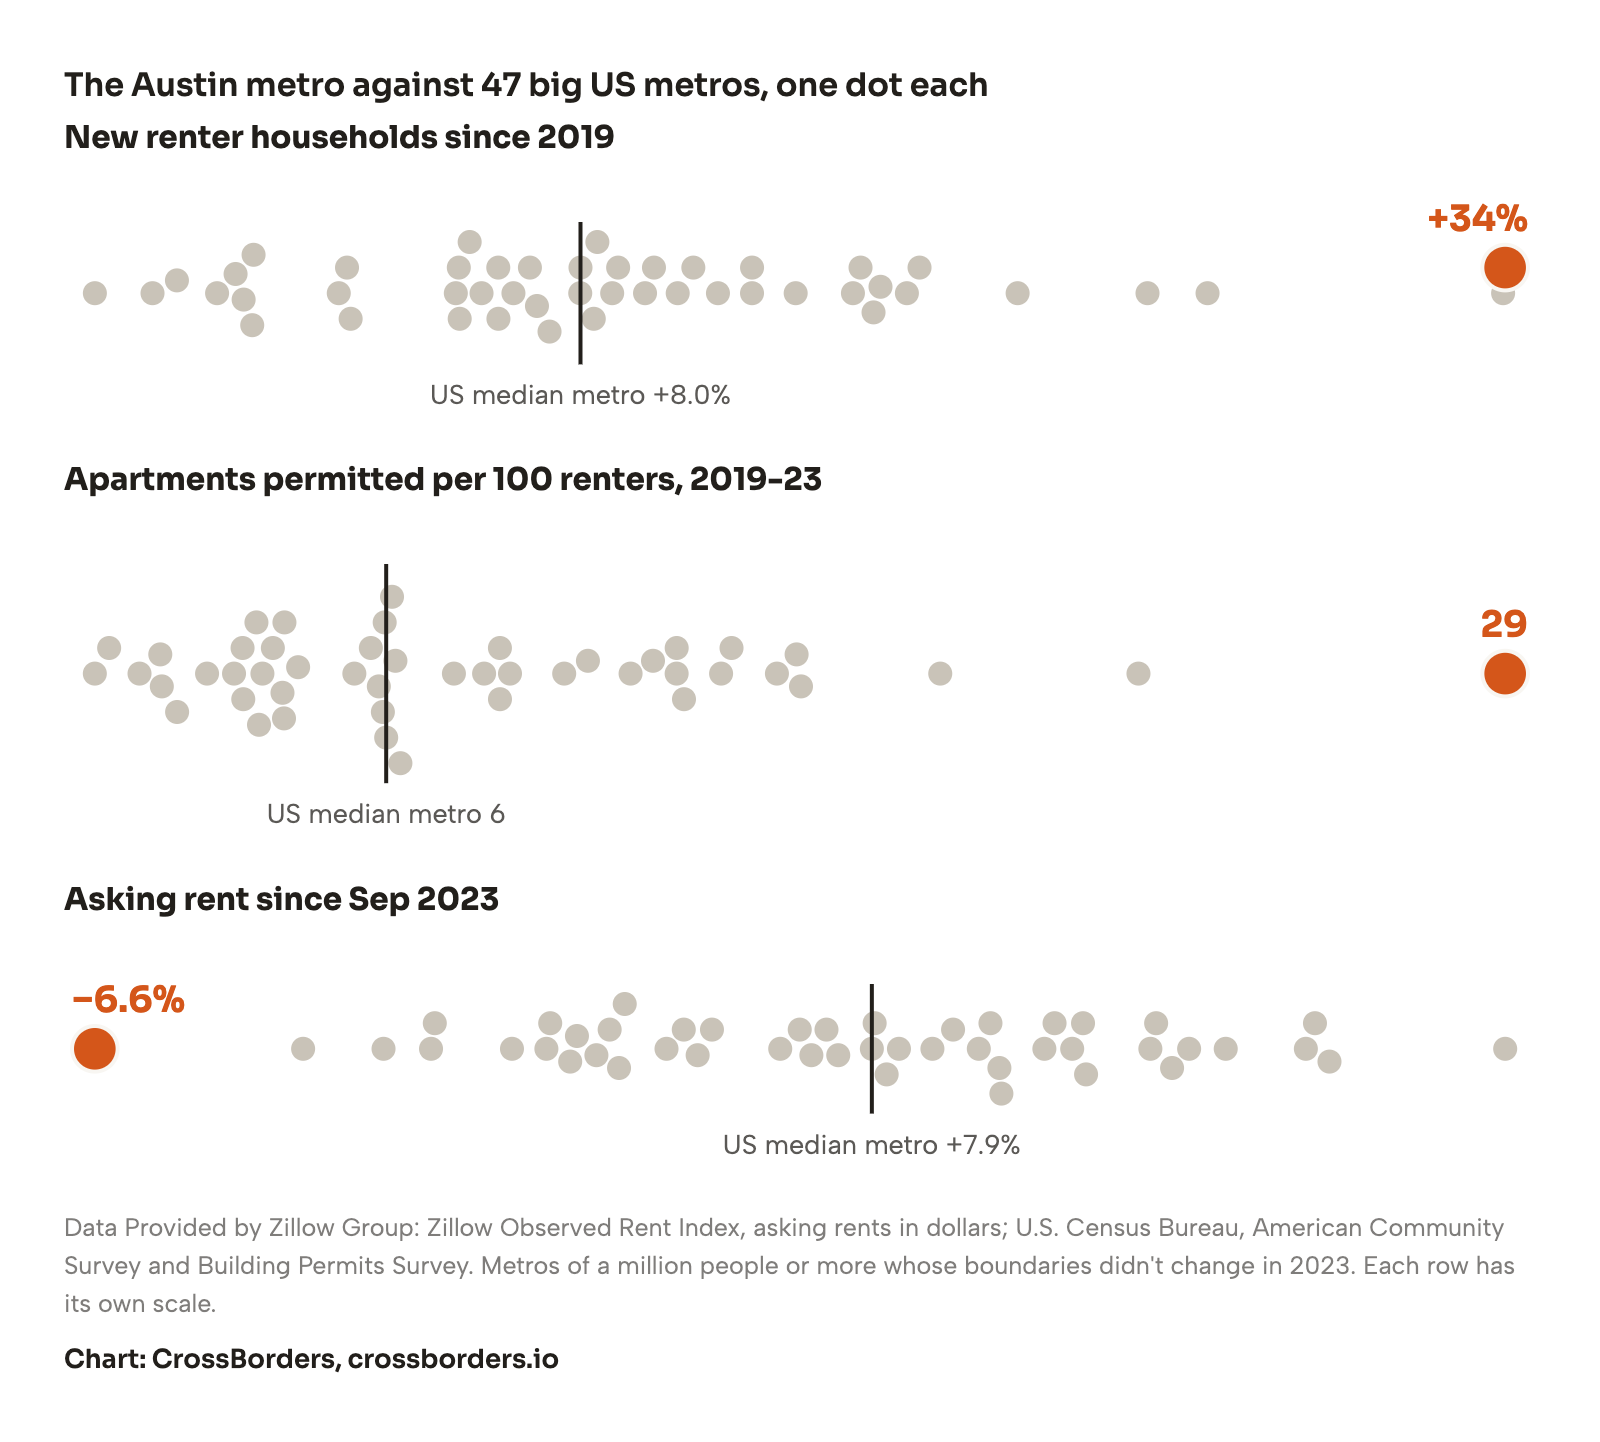
A metro gaining renters that fast would normally see rent go up. But a building takes about two years to go from buying the land to welcoming tenants, so everything planned in the frenzy opened into the same market at about the same time. Developers added almost 50,000 rental units in 2023 and 2024, the biggest percentage gain of any major US metro, and for a while, says Daniel Oney of the Texas Real Estate Research Center, "there were four apartments for every household that showed up."
You could feel the balance of power change. Mycah Miller, a graduate student in a 1960s apartment in Hyde Park, had just taken a rent rise of nearly 15% when she mentioned to the landlord, during a plumbing repair, that she was thinking of moving somewhere cheaper, and weeks later an email arrived lowering the rent by $40. In the heart of downtown, a tower with an indoor cinema and a 20th-floor pool was offering up to eight weeks free. Rents in older, cheaper buildings fell hardest, about 11% in a single year, which reaches people who were never going to rent a tower, although Walter Moreau, who runs the housing nonprofit Foundation Communities, says "folks with really tight budgets are still really stretched."
Data: U.S. Census Bureau, Building Permits Survey. Units in buildings of five or more, counted when permitted, not when finished. Hover or tap a year.
It would be easy to put all of this down to empty Texas land, and Austin certainly has it, with apartments going up in places like Georgetown and Leander. But 63% of the apartments permitted in the metro from 2019 to 2023 were inside Austin's city limits. Those limits are wide, so not all of that is the urban core, but downtown now has apartments in towers of 66 and 74 stories, and zoning the city created in 2007 to allow more apartments per site and far less parking accounts for more than 17,600 homes built or under way.
None of it came easily. Austin spent five years and $8.5 million rewriting its building code before the city council killed the effort in 2018. When the council tried again, a group of homeowners sued and won in 2020, then won again in 2023 over a later set of reforms. As rents soared, housing became the top issue in local politics, and since 2022 the city has gone after permit delays, loosened limits on the height of buildings near single-family homes and become the largest US city to end parking mandates. Those newest changes came too late to explain the cranes of 2021, which owed more to a hot market and older reforms like that 2007 zoning.
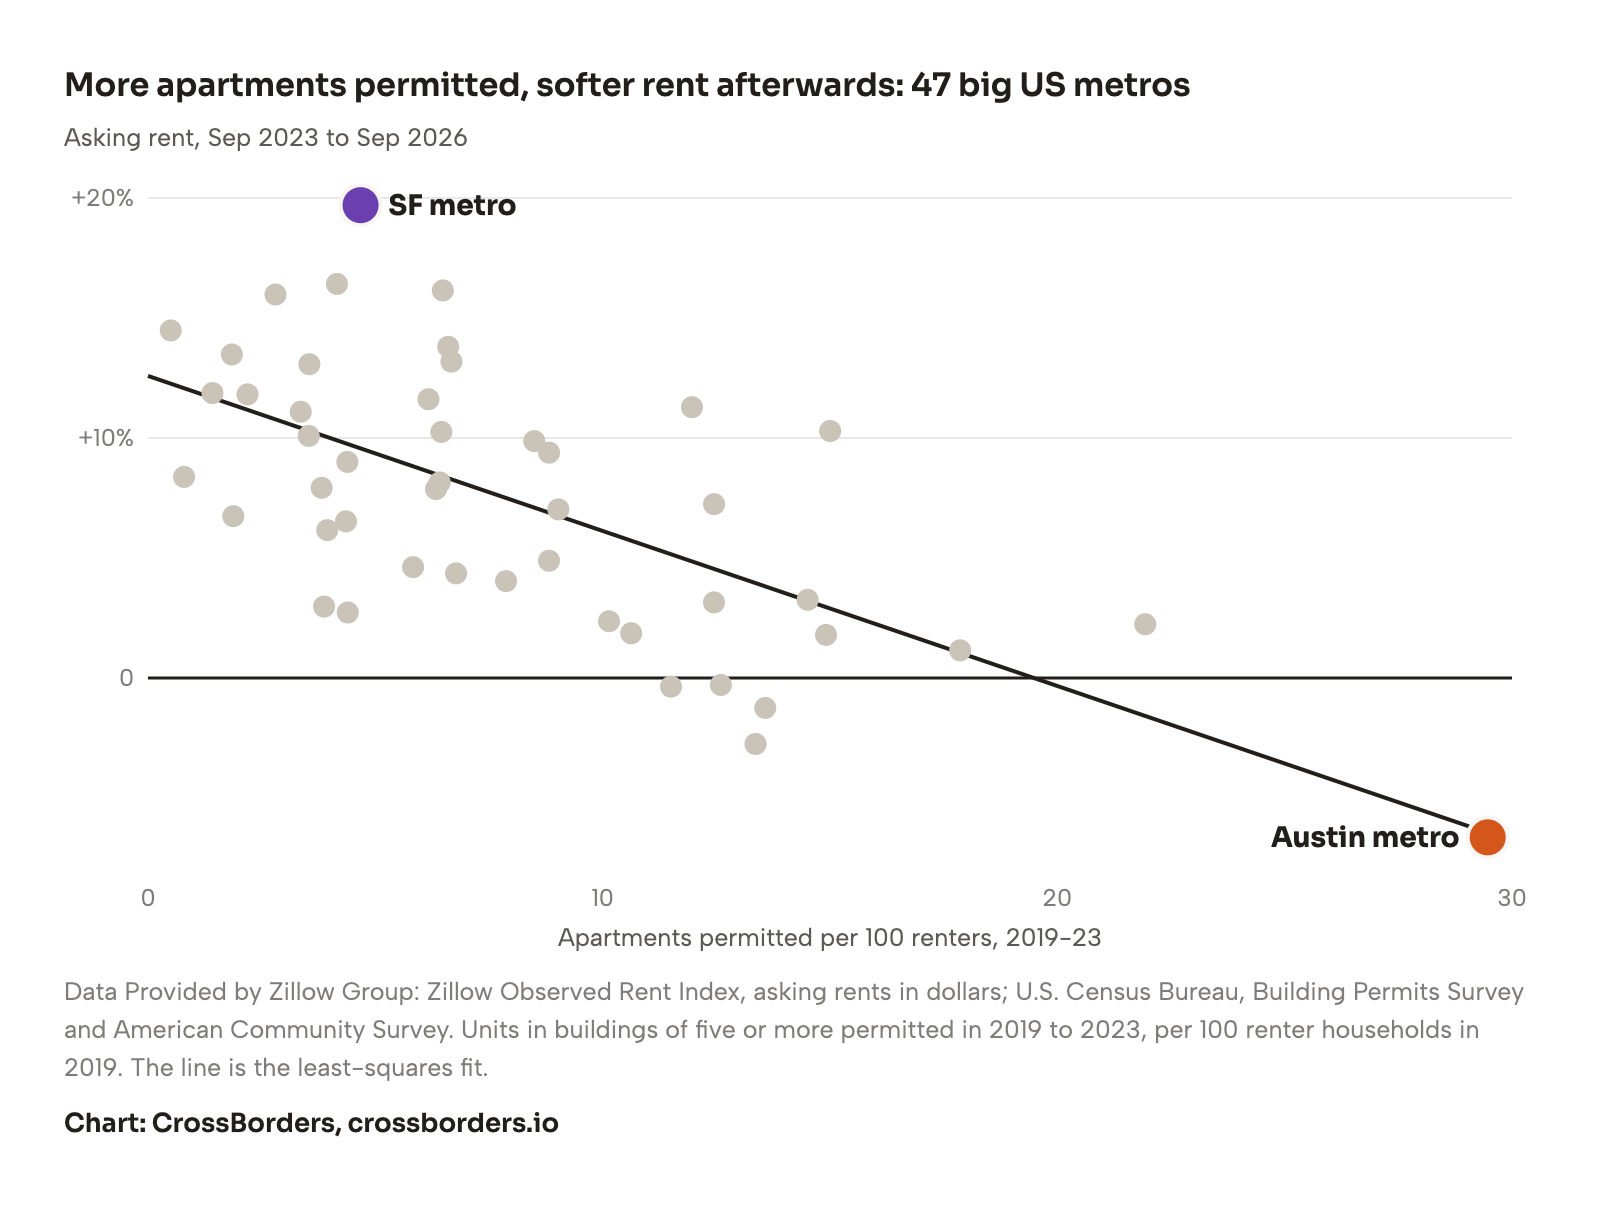
Austin is not a one-off either. Across 47 big metros, the more apartments a metro permitted in 2019 to 2023, the softer its asking rents since Sep 2023 (r = −0.66, p < 0.001, and −0.59 without Austin).
Data Provided by Zillow Group: Zillow Observed Rent Index, asking rents in dollars; U.S. Census Bureau, Building Permits Survey and American Community Survey. Units in buildings of five or more permitted in 2019 to 2023, per 100 renter households in 2019. The line is the least-squares fit. Hover or tap a dot.
Use this chart in your article: chart image, data (CSV), how to credit.
That wave is now going out. Some builders were already dismantling their cranes by early 2024, the Austin metro's rent has stopped falling, up 0.7% in the past year, and Oney reckoned in January that the empty apartments would take about three years to fill if nothing new were added.
San Francisco, with the Transamerica Pyramid. Photo: Mo Eid / Pexels.
San Francisco's slump came and went with little built
The San Francisco metro had the opposite few years. Asking rents fell 8.2% in 2020 and took until 2022 to get back, and by 2025 the metro had 5.8% fewer working residents than in 2019, the biggest drop of any big metro. A soft market is when you would want to line up the next round of housing, and one parking lot shows how that went.
In October 2021 developers had plans for 495 apartments on a Nordstrom valet lot at 469 Stevenson Street in SoMa. At a hearing about the project's environmental review, the Board of Supervisors voted to hold it up, with only three supervisors on the other side, and the mayor at the time, London Breed, fumed: "If you're wondering how we got into our housing crisis, this is how." The state housing department opened an inquiry, and the city approved the project in 2023. A state review that year found that from 2018 to 2021 San Francisco took a median of 34 months to approve an apartment project, more than ten months longer than the next-slowest place in California.
Data Provided by Zillow Group: Zillow Observed Rent Index, asking rents in dollars; U.S. Census Bureau, American Community Survey and Building Permits Survey. Metros of a million people or more whose boundaries didn't change in 2023. Each row has its own scale. Hover or tap a dot.
Use this chart in your article: chart image, data (CSV), how to credit.
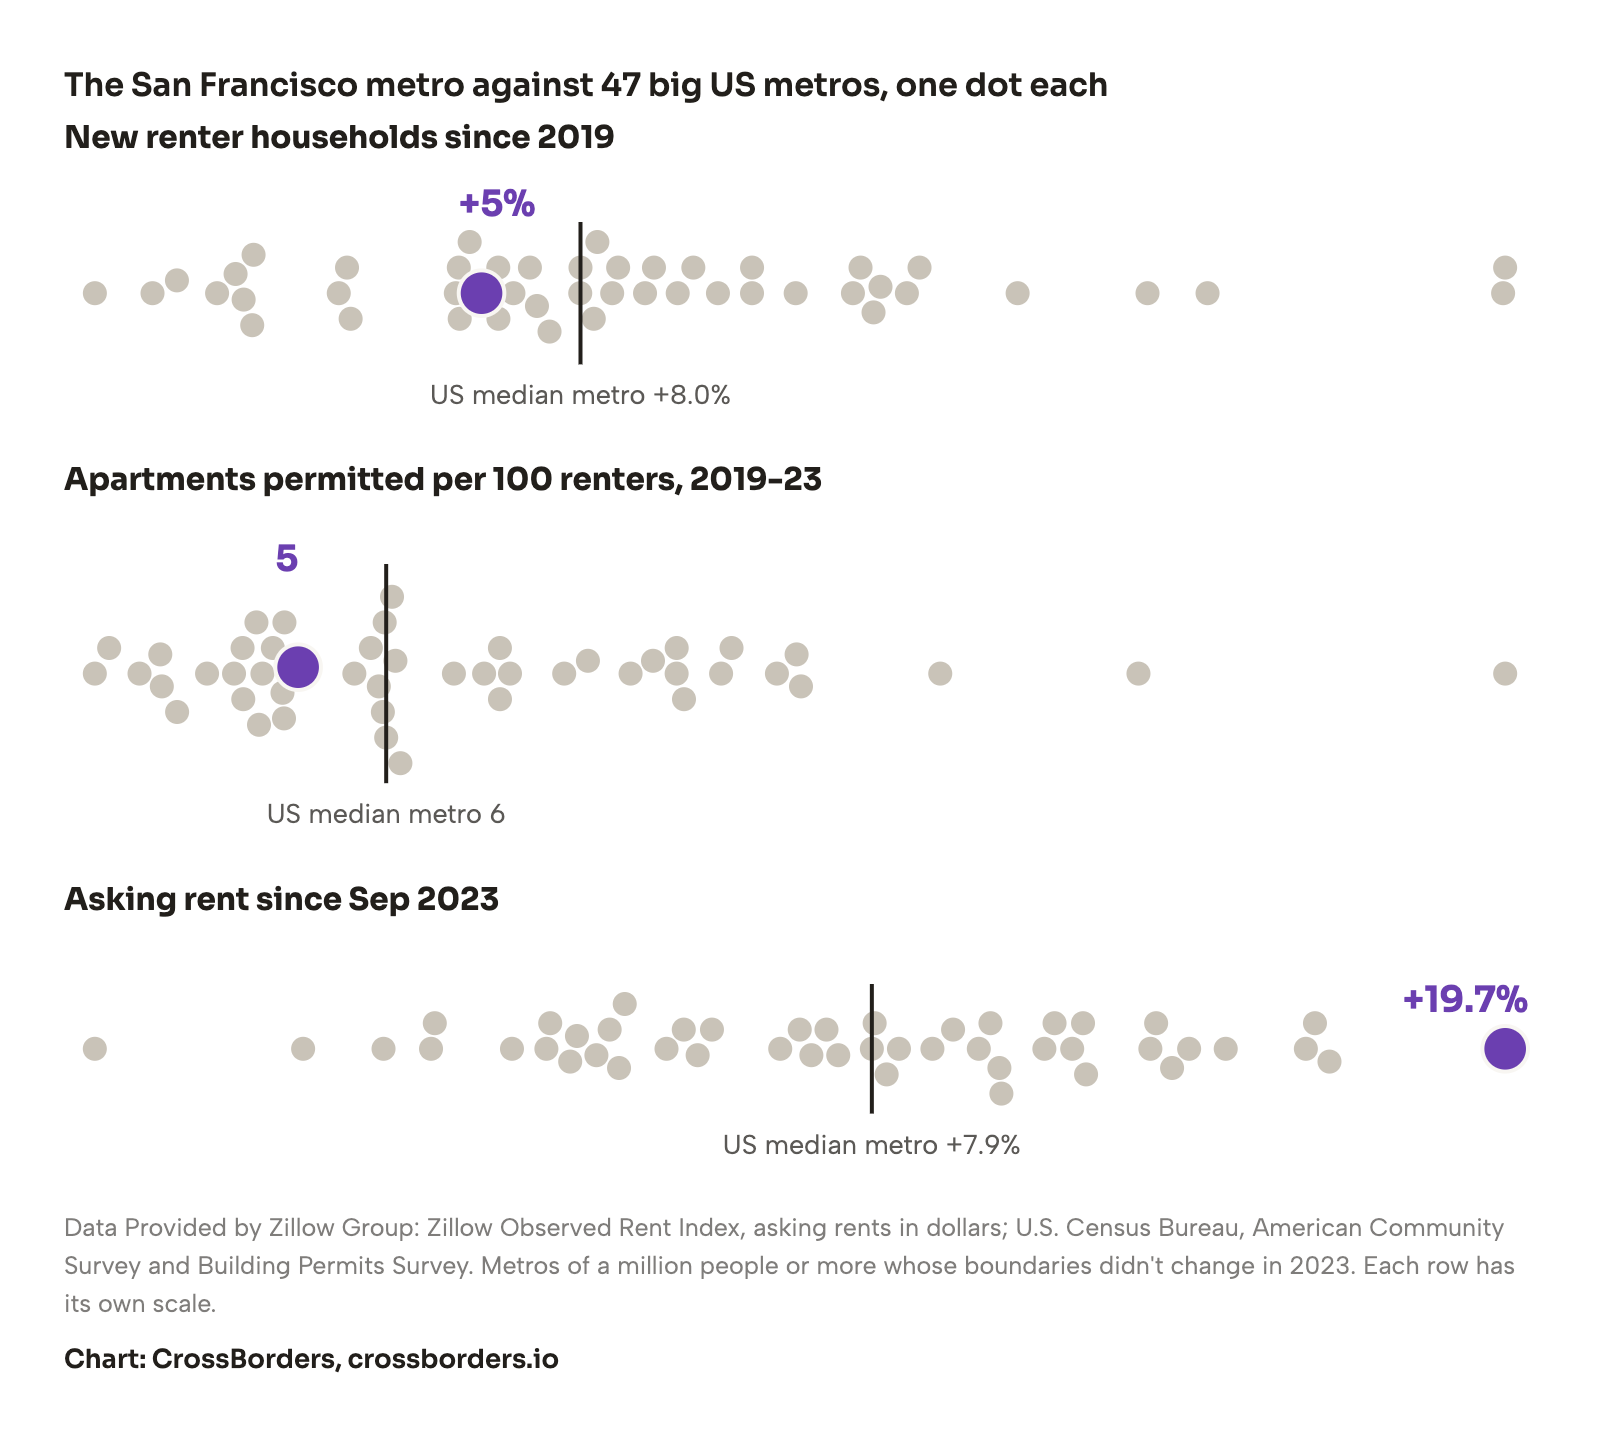
Then the AI boom arrived, and there was little new housing waiting for it. The brokerage JLL counted two leases by AI companies in the city in 2020 and 167 by early 2025, which helped pull office vacancy from above 35% to about 30%. The city's chief economist, Ted Egan, says "AI is the big reason" rents are growing so fast, even though tech job growth has been muted because AI "is eliminating jobs as well as adding jobs." A one-bedroom corner unit in Rincon Hill that rented for $5,140 last year went for almost $6,800 this year, and an agent with a $55,000-a-month house in Pacific Heights described its target renters as "very young, very wealthy, and very much terrified of commitment."
Asking rents in the metro are up 11.8% in a year to a record $3,445, the most of any big metro, and in the city itself they are up 26.4% to $4,784, against 10.8% in Oakland across the bay. Zumper, which tracks listings, puts it down to AI hiring and very little new supply, and in September, standing in Alamo Square Park, Mayor Daniel Lurie declared a rent emergency, a largely symbolic step that came with proposals to protect tenants.
Not everyone is paying those prices. San Francisco's rent control generally covers apartments in buildings first occupied before June 1979, where the allowed increase this year is 1.6%, so someone who has stayed put may barely feel the boom. The rents in this story are for the next lease, or as Quintin Mecke of the Council of Community Housing Organizations puts it, "what landlords believe they can get from the next tenant, not what sitting tenants are paying."
Data: U.S. Census Bureau, Building Permits Survey. Units in buildings of five or more, counted when permitted, not when finished. Hover or tap a year.
San Francisco can't spread out, so it has to build up
Comparing building in these two places only goes so far, because they are shaped so differently. The city of San Francisco is 47 square miles of land with water on three sides, and 826,000 people already live on it, nearly six times as densely as in Austin, whose city limits take in 326 square miles. The metros differ too: the San Francisco metro wraps around a bay on 2,470 square miles of land, and the Austin metro has 4,220 and can keep spreading. A builder around Austin can still start with an empty field, while a San Francisco builder has to find a parking lot or replace something, and usually go taller.
Land alone doesn't settle it, though. Seattle, squeezed between Puget Sound and Lake Washington, has fewer people than San Francisco and less than twice the land, and from 2019 to 2023 it permitted 35,800 apartments to San Francisco's 10,500. Boston has almost the same land as San Francisco and permitted 14,700. Manhattan has less than half the land and permitted 17,900, and Brooklyn, on about one and a half times the land, permitted 51,000.
Much of the rest comes down to San Francisco's own rules. Across most of the north and west of the city, buildings are limited to 40 feet, or about four stories, and the city's planners say 90% of housing was built outside the state's "housing opportunity areas", even though those areas, largely on that side of town, cover over half the city. In December 2025 the supervisors passed the Family Zoning Plan, which lets owners fit more homes inside the 40-foot limit and allows taller buildings on major transit and shopping streets. Of the sites it covers, 77% get no extra height, and buildings with three or more rent-controlled units are exempt. It makes room for 36,000 homes on paper, but the city's chief economist projected 8,500 to 14,600 over 20 years, and it has been sued from both sides, over its environmental review and over whether it does enough to meet state housing law.
New rules don't pay for a building, either. Janan New of the San Francisco Apartment Association says "the cost of construction is just skyrocketing," and only 489 homes had been completed in the city this year by the time the mayor declared the emergency. Mecke describes the mismatch in one line: "Rents respond to a demand shock in months," while housing "takes years from entitlement to occupancy." That lag runs through this whole story. Austin's cranes went up in a boom and its rents came down years later, once the apartments opened, and whatever San Francisco's new rules produce will arrive long after this year's renters have signed their leases.
Where does your metro stand?
Data Provided by Zillow Group: Zillow Observed Rent Index, asking rents in dollars, metro areas, Sep 2026. Peak is the highest month since Dec 2019. *The metro's boundaries changed in 2023, so it is left out of the charts. Tap a metro to add it to the charts.
We'll send a confirmation link. The newsletter brings new data stories and relocation intel, a few emails a month. Some links may be affiliate links, and you can unsubscribe anytime. See our privacy policy.
For reportersCharts, data, credit line and findings you can quote
Use these charts in your article, no need to ask. Please link to this story as the source. Wherever the rent figures appear, keep the line "Data Provided by Zillow Group", which Zillow's Terms of Use require, without Zillow's logo. In print, credit CrossBorders and Zillow.
Download all charts and data (.zip)Source: CrossBorders, "A tale of two tech cities", 1 November 2026, using the Zillow Observed Rent Index and US Census Bureau data. Data Provided by Zillow Group. https://crossborders.io/insights/a-tale-of-two-tech-cities
- Asking rents in the Austin metro were 10.8% below their Aug 2022 peak in Sep 2026, the furthest of any US metro of a million people or more.
- Asking rents in the San Francisco metro reached a record $3,445 in Sep 2026, up 11.8% in a year. In the city itself they were $4,784, up 26.4%.
- Since Sep 2023, asking rents changed -6.6% in the Austin metro and +19.7% in the San Francisco metro, the lowest and highest of 47 big metros.
- Austin gained 119k renter households from 2019 to 2025 and permitted 116k apartments from 2020 to 2025. Homes empty and for rent went from 21k in 2019 to 10k in 2021 and 37k in 2025.
- Austin permitted 29.5 apartments per 100 renters in 2019 to 2023, the most of any big metro. The San Francisco metro permitted 4.7.
- Across 47 big metros, those that permitted more apartments per renter in 2019 to 2023 had softer asking rents from Sep 2023 to Sep 2026 (r = -0.66, p < 0.001; -0.59 without Austin). That is a correlation, not proof of cause.
- The city of San Francisco, on 47 square miles of land, permitted 10,489 apartments in 2019 to 2023. The city of Seattle, on 84 square miles with fewer people, permitted 35,763.
These are asking rents for metro areas, in dollars, not what every renter pays. None of this shows what caused what.
Questions, corrections or another cut of the data: [email protected].
The rent data belongs to Zillow and follows its Terms of Use, so these files carry our calculated changes and not its monthly series, which you can download from Zillow Research. The photos, and figures the story credits to other sources, belong to their owners.
What else we testedWorking from home, population, starting rent, earlier years, rent against pay
- Working from home looks linked at first: metros with more people at home have softer asking rents since Sep 2023 (r = −0.47). But those are largely the metros that built. Hold permits constant and it disappears (r = −0.02), while permits hold up with home working held constant (r = −0.53).
- Metros that gained the most people also have softer asking rents (r = −0.62), but those too are largely the metros that built. Hold permits constant and the link falls to r = −0.31.
- What a metro cost in 2019 has little link with how its rent moved since Sep 2023 (r = +0.19).
- Both metros had a long run-up before this story starts. On the Census measure of what all renters pay, rent rose 56.5% in the San Francisco metro from 2010 to 2019 and 44.4% in the Austin metro, against 28.9% for the US median metro.
- On the same Census figures for 2025, the median rent took 29.5% of median renter income in the Austin metro and 30.2% in the San Francisco metro, so for people already renting the two are close.
What these numbers don't sayCause and effect, asking rents, city against metro, and other limits
- None of this proves what caused what. Permits and rent can move together for other reasons. The link holds for permits per renter; subtract new renters from permits and it doesn't (r = +0.27).
- San Francisco got an AI boom and Austin did not, so a single year in those two places can't separate a jump in demand from a shortage of homes. The comparison across 47 metros is the better test of building, and it ends before anyone can see how the boom plays out.
- These are asking rents, what you would pay on a new lease, in dollars and for whole metro areas unless we say otherwise. Zillow weights its index to reflect all rental housing, but it is built from listings, so it is not what sitting tenants pay. The Census, which counts every renter including rent-controlled leases, only runs to 2025, and on that measure the San Francisco metro was still 4.7% below 2019 after inflation. Texas law makes rent control hard to enact, so Austin has none.
- The San Francisco metro here is five counties: Alameda, Contra Costa, Marin, San Francisco and San Mateo. San Jose and Silicon Valley are a separate metro, up 8.3% in the past year. The Austin metro is also five counties.
- City limits flatter Austin. Its limits are about seven times as large as San Francisco's, and per square mile of land the city of Austin permitted fewer apartments than San Francisco from 2019 to 2023 (196 against 225). Comparing Seattle, Boston, Manhattan and Brooklyn on land leaves out their own zoning, costs and tax rules.
- The San Francisco and Austin metros were chosen as the story, not picked by a rule. The table shows every big metro.
- Permits count every unit in buildings of five or more, including some condos, and not every permit gets built. Some permitted from 2023 on are not finished yet.
- A six-week federal shutdown suspended Census survey collection in late 2025. The Census Bureau says this reduced the sample and widened margins of error.
Sources and methodZillow, Census and BLS data, the tests, context sources
Data Provided by Zillow Group. Zillow Observed Rent Index (ZORI), smoothed, all homes plus multifamily, by metro and city, Dec 2019 to Sep 2026, downloaded 2026-11-01, shown under Zillow's Terms of Use. It tracks asking rents for the same homes over time, in dollars. The monthly series themselves are on Zillow's research page.
U.S. Census Bureau, American Community Survey 1-year estimates: renter households (B25003), homes empty and for rent (B25004), employed residents (S2401), people working from home (B08006), population (B01003), renter income (B25119) and median gross rent (B25064) for the all-renters comparison, deflated with regional CPI-U. No standard 1-year estimates exist for 2020.
The 56 metro areas of a million people or more in 2025, leaving out San Juan. Comparisons across metros use the 47 whose population did not jump or drop 2.5% or more in 2023, when new boundaries came in: Birmingham, Fresno, Cleveland, Grand Rapids, Hartford, Louisville, Nashville, Pittsburgh, Rochester are left out. The US median metro is the median of each metro's own change.
Pearson correlation across metros, with t = −6.0 for permits against asking rent. On all 56 metros, r = −0.69.
Building Permits Survey annual place files, units in buildings of five or more, grouped by metro, with the cities and boroughs read directly. Land areas from the Census 2024 Gazetteer files. Census note on the lapse in appropriations and data collection.
- Austin in 2021 and 2024: NPR, KUT; headquarters moves, Fox LA
- Austin's new apartments, deals and code fights: Bloomberg citing Fannie Mae; Spectrum News; KUT; KUT and Austin Chronicle on the lawsuits; Smart Cities Dive on the Pew study; REBusinessOnline on the towers
- 469 Stevenson: The San Francisco Standard, Mission Local; approval times, KQED on the California housing department's review
- San Francisco's rent surge: The San Francisco Standard in August, July and September; CBS News citing Zumper
- Rent control: San Francisco Rent Board on coverage and this year's increase
- Family Zoning Plan: San Francisco Planning, its fact sheet and presentation to supervisors; KQED on what it covers and on the chief economist's report; Sheppard Mullin on the lawsuits
Every chart on this page comes from one reproducible script. Download our calculations and the Census data for all 56 metros.